Table of Contents
- What Is the Problem with Static Floor Plans?
- What Is an Interactive Tower Map?
- How Does an Interactive Tower Map Work?
- Why Do Interactive Floor Plans Increase Pre-Sales?
- Interactive Tower Maps vs Static Floor Plans
- Who Should Use Interactive Tower Maps?
- How Does FoudaTech Build Interactive Tower Maps?
- Frequently Asked Questions
What Is the Problem with Static Floor Plans?
Every real estate developer has the same sales workflow. A potential buyer visits the website, downloads a PDF floor plan, squints at tiny unit labels, and then calls the sales office to ask basic questions.
How many bedrooms does Unit 4B have?
What is the price per square meter on the 12th floor?
Which units face the pool?
These are questions your website should answer instantly. Instead, your sales team spends hours repeating the same information that could be displayed interactively on a single page.
Here is what happens when a buyer compares three towers in the same district:
| Developer A | Developer B | Developer C |
|---|---|---|
| Static PDF download | Static images on website | Interactive tower map |
| Buyer downloads, opens in separate app | Buyer scrolls through generic photos | Buyer hovers over units, sees pricing instantly |
| Buyer calls sales office for pricing | Buyer emails for availability | Buyer clicks unit, sees gallery and availability |
| Response time: 24–48 hours | Response time: 4–8 hours | Response time: instant |
Developer C wins that buyer every time. Not because their building is better — but because they answered the question first.
Static floor plans made sense in 2010. In 2026, they are a conversion bottleneck that costs you pre-sales every single day.
What Is an Interactive Tower Map?
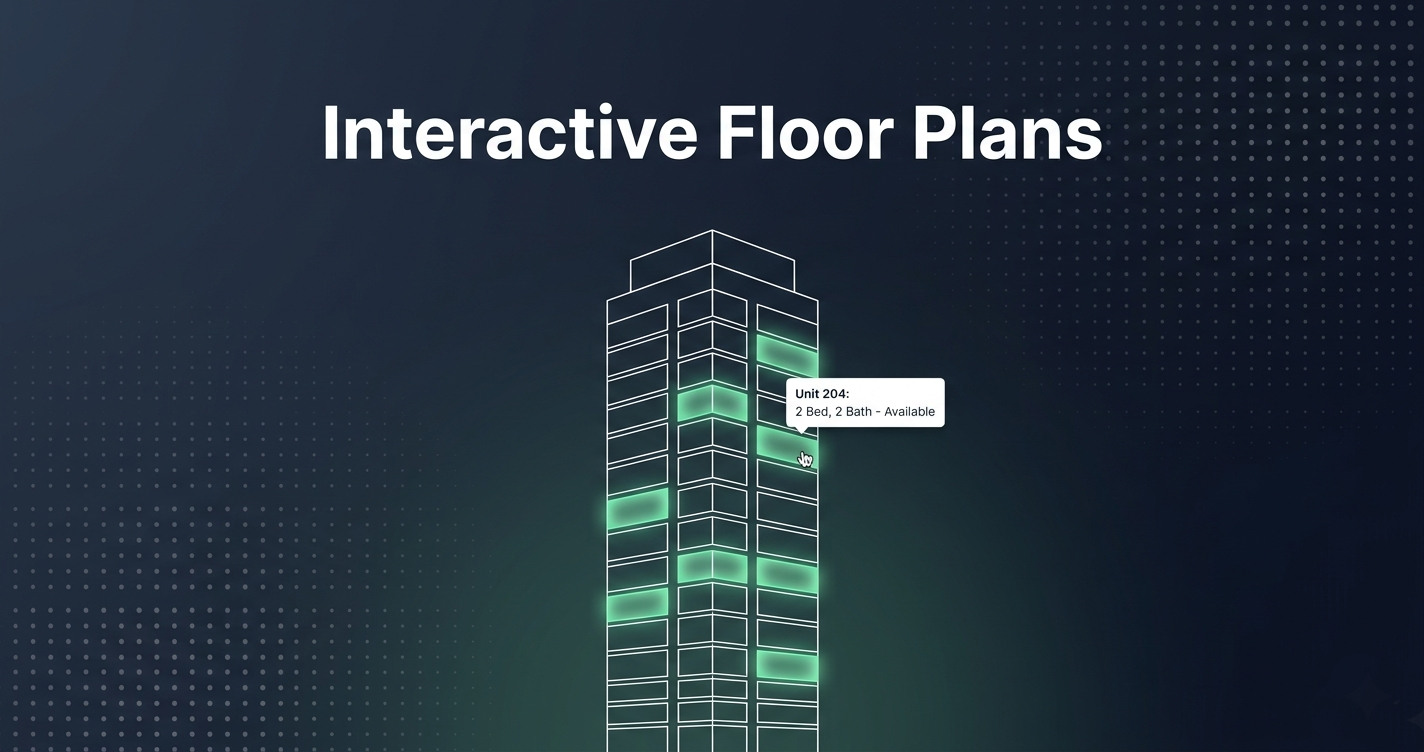
An interactive tower map is a visual overlay system built on top of your existing 2D tower elevation image. When a buyer visits your property page, they see the full tower rendering — the same image you already use in your brochures.
The difference is what happens when they interact with it.
Hover over any unit and its boundaries highlight instantly. A tooltip appears showing the unit number, floor, total area, number of bedrooms, and current price.
Click on a unit and a detailed panel opens — showing a full image gallery of the unit type, bathroom count, view orientation (pool side, street side, sea view), availability status, and a direct inquiry button.
No PDFs. No phone calls. No friction between interest and action.
“97% of home buyers use the internet during their property search.” — National Association of Realtors, 2026
Your tower website is not a brochure. It is your highest-volume sales agent.
How Does an Interactive Tower Map Work?
Building an interactive tower map requires three precision-engineered layers:
1. The Image Overlay Layer
Your existing 2D tower elevation image serves as the base. On top of it, an SVG coordinate system defines the clickable boundaries of every unit. Each boundary is mapped as a scalable vector polygon that transforms responsively across desktop, tablet, and mobile viewports — pixel-perfect at every size.
2. The Data Layer
Every unit connects to a structured data source containing its metadata:
| Data Point | Example |
|---|---|
| Unit number | 4B |
| Floor | 12th |
| Total area | 125 m² |
| Bedrooms | 3 |
| Bathrooms | 2 |
| View orientation | Pool side |
| Price | $285,000 |
| Status | Available |
| Gallery | 6 images |
This data layer can be managed through a simple dashboard where your sales team updates pricing and availability in real time — without touching code.
3. The Interaction Layer
Hover states, click handlers, tooltip positioning, and panel animations are engineered with vanilla JavaScript — no heavy frameworks required. The entire interactive system typically adds less than 50KB to your page, ensuring it loads instantly even on mobile networks in emerging markets.
Why Do Interactive Floor Plans Increase Pre-Sales?
Interactive tower maps don’t just look impressive. They measurably change buyer behavior at three critical stages of the purchasing journey.
1. How Do Interactive Maps Reduce Bounce Rate?
A buyer comparing three towers in the same district will spend more time on the site that answers their questions immediately. If your competitor shows an interactive unit explorer and you show a downloadable PDF, you lose that buyer before your sales team even knows they existed.
The data is clear:
| Metric | Static PDF | Interactive Tower Map |
|---|---|---|
| Average time on page | 45 seconds | 3–5 minutes |
| Bounce rate | 65–80% | 20–35% |
| Inquiry conversion rate | 1–2% | 8–15% |
| Sales team call volume | High (repetitive questions) | Low (qualified inquiries only) |
2. How Do Interactive Maps Create Emotional Engagement?
Hovering over units, seeing real photos, and visualizing the view from a specific floor creates emotional ownership. The buyer begins imagining themselves in that unit. This psychological engagement is impossible to achieve with a static document.
When a buyer spends four minutes exploring units on the 15th floor, comparing pool-view versus street-view options, and scrolling through interior gallery images — they are already mentally moved in. Your sales team is closing a warm lead, not a cold inquiry.
3. How Do Interactive Maps Generate Qualified Leads?
When a buyer clicks the inquiry button from a specific unit panel, your sales team receives a lead that includes:
- The exact unit number the buyer was viewing
- The floor they were exploring
- The price point they were considering
- The view orientation they preferred
This is a qualified lead — not a generic “I’m interested in your project” contact form submission. Your sales team knows exactly what to discuss before they pick up the phone.
Interactive Tower Maps vs Static Floor Plans
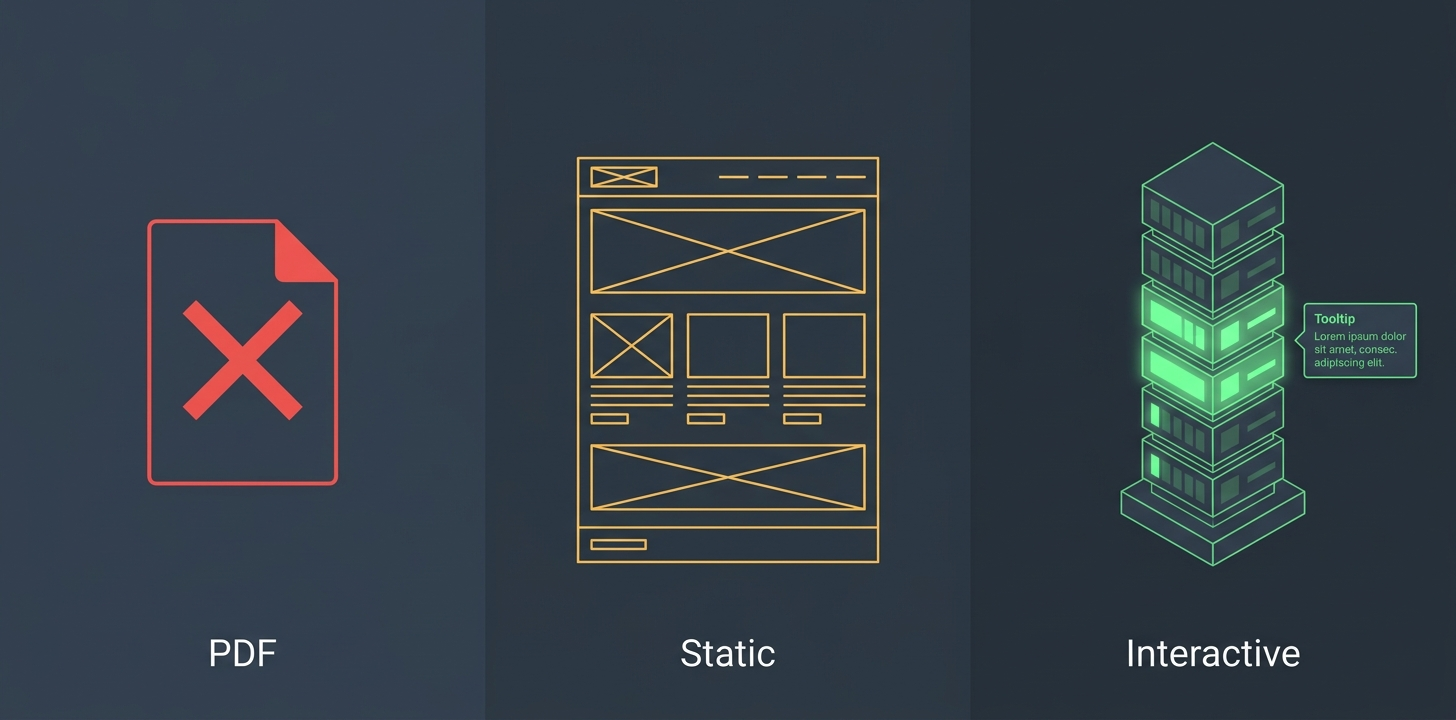
| Feature | Static PDF | Static Website Images | Interactive Tower Map |
|---|---|---|---|
| Unit-level pricing | ❌ Requires phone call | ❌ Generic price ranges | ✅ Per-unit pricing on hover |
| Availability status | ❌ Outdated within days | ❌ Manually updated | ✅ Real-time dashboard updates |
| Unit gallery | ❌ Separate brochure | ⚠️ Generic project photos | ✅ Per-unit type gallery |
| Mobile experience | ❌ PDF unreadable on phone | ⚠️ Scroll-heavy | ✅ Touch-optimized overlays |
| Lead quality | ❌ Generic inquiries | ❌ Generic inquiries | ✅ Unit-specific qualified leads |
| Sales team workload | 🔴 High (repetitive answers) | 🟡 Medium | 🟢 Low (automated information) |
| Page load impact | 🟡 Separate download | ✅ Fast | ✅ Under 50KB total |
| Update process | ❌ Redesign and re-upload PDF | ⚠️ Developer needed | ✅ Dashboard — no developer |
Who Should Use Interactive Tower Maps?
This technology is built for:
- Real estate developers launching new tower or condominium projects who want to maximize pre-sales before construction completes
- Property marketing agencies managing multiple developments who need a competitive differentiator for their clients
- Construction companies that want to offer pre-sale visibility during the build phase to secure financing
- Real estate platforms that list multiple properties and want to stand out from competitors showing static listings
The qualifying question is simple: Are you selling units in a multi-story building and does your current website show static images or PDF downloads? If yes, you are leaving pre-sales on the table every day.
How Does FoudaTech Build Interactive Tower Maps?
I engineer interactive tower maps as a dedicated full-stack architect — not as a SaaS template you configure yourself. Every tower map is custom-built to match your brand, your building, and your sales workflow.
The 5-Step Delivery Process
| Step | What Happens | Timeline |
|---|---|---|
| 1 | You send your tower elevation image (PNG, JPG, SVG, or PDF) | Day 1 |
| 2 | I map every unit boundary with pixel-precise SVG overlays | Day 2–3 |
| 3 | You provide unit data (pricing, area, rooms, gallery images) | Day 3–4 |
| 4 | I build the interactive system + management dashboard | Day 4–10 |
| 5 | I deliver an embeddable widget — single script tag for your website | Day 10–14 |
Direct access to the architect from day one. No agency layers, no project managers relaying messages. One engineer, one deliverable, complete code ownership.
What Makes This Different from SaaS Tools?
| Factor | SaaS Floor Plan Tools | FoudaTech Custom Build |
|---|---|---|
| Design | Generic templates | Custom-matched to your brand |
| Performance | 200KB+ framework overhead | Under 50KB — zero frameworks |
| Dashboard | One-size-fits-all | Built for your sales workflow |
| Pricing | Monthly subscription forever | One-time build — you own the code |
| Support | Ticket queue | Direct architect access |
| Customization | Limited to template options | Unlimited — it’s your code |
Explore Interactive Tower Maps →
Frequently Asked Questions
How much does an interactive tower map cost?
Each tower map is custom-engineered based on the complexity of your building — number of towers, floors, and units. Contact me directly for a project estimate. Because I operate as a solo architect with zero agency overhead, pricing is typically 30–50% below equivalent agency quotes.
How long does it take to build an interactive tower map?
A standard single-tower map with up to 100 units takes approximately 2 weeks from receiving your tower image to delivering the embeddable widget. Multi-tower complexes with 200+ units typically take 3–4 weeks.
Can my sales team update pricing and availability without a developer?
Yes. Every tower map includes a management dashboard where your team can toggle unit availability (Available, Reserved, Sold), update pricing, and upload gallery images — no developer intervention required after delivery.
Does the interactive tower map work on mobile phones?
Yes. The SVG overlay system scales mathematically across every viewport. Touch interactions replace hover states on mobile — tap to see unit details, tap again to open the full detail panel. The system loads in under one second on 3G mobile connections.
Can I keep my tower map private from competitors?
Absolutely. You choose whether your tower map appears in the FoudaTech showcase or remains exclusively on your website. Private deployments include full white-label delivery with zero FoudaTech branding visible to your buyers.
What if I already have a website? Do I need to rebuild it?
No. The tower map is delivered as an embeddable widget — a single script tag that drops into your existing website. No migrations, no redesigns. It works alongside your current content on any platform.