Table of Contents
- Why Are Traditional Pre-Sales Methods Failing?
- What Do Modern Property Buyers Expect?
- What Are the 5 Technologies That Increase Pre-Sales?
- How Do Interactive Tower Maps Change the Pre-Sales Game?
- What Results Can Developers Expect?
- How Should Developers Prioritize Their Technology Investment?
- Frequently Asked Questions
Why Are Traditional Pre-Sales Methods Failing?
The real estate pre-sales playbook has not changed in 20 years:
- Build a showroom
- Print brochures with floor plans
- Hire a sales team to answer phone calls
- Wait for buyers to visit in person
This worked when buyers had no alternatives. In 2026, they have dozens.
A buyer researching a new tower development in Accra, Dubai, or Istanbul does not drive to your showroom first. They open their phone, compare three developments side by side, and spend their time on the website that answers their questions fastest.
| Traditional Approach | What Happens |
|---|---|
| PDF floor plan on website | Buyer downloads, squints at tiny labels, calls sales office — or moves to the next developer |
| Static renders and photos | Buyer scrolls through generic images with no unit-specific information |
| ”Call for pricing” on every unit | Buyer calls your competitor who shows pricing instantly online |
| Showroom visits required | Buyer eliminates you before visiting because your website gave them nothing |
The developers who are winning pre-sales in 2026 are not spending more on showrooms. They are investing in digital pre-sales tools that let buyers explore, compare, and decide before they ever speak to a salesperson.
What Do Modern Property Buyers Expect?
Buyer expectations have shifted permanently:
| Expectation | Old Standard | 2026 Standard |
|---|---|---|
| Pricing information | Call the sales office | Visible per unit on the website |
| Unit exploration | Download a PDF | Interactive hover-and-click experience |
| Availability status | Ask the sales team | Real-time status visible online |
| Gallery images | Generic project renders | Per-unit-type interior galleries |
| Response time | 24–48 hours via email | Instant — self-service on the website |
| Mobile experience | Desktop-only website | Full mobile optimization |
97% of property buyers use the internet during their search. The developer who meets these expectations online captures the buyer. The developer who doesn’t — loses them to someone who does.
What Are the 5 Technologies That Increase Pre-Sales?
1. Interactive Tower Maps
This is the highest-impact technology for any developer selling units in a multi-story building.
An interactive tower map turns your existing 2D elevation image into a fully explorable sales tool:
- Hover over any unit → see pricing, area, floor, bedrooms
- Click any unit → see gallery images, view orientation, availability
- Inquire directly → lead includes the exact unit, floor, and price point
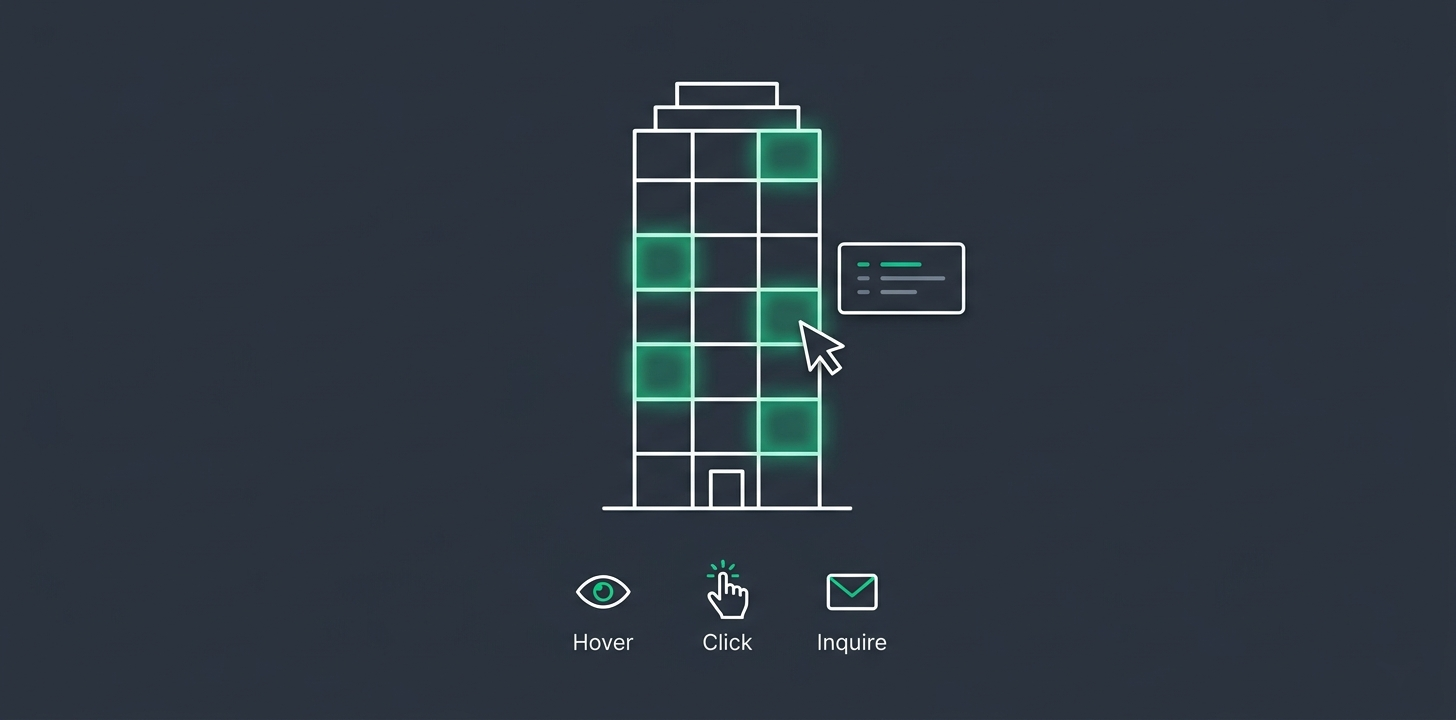
Why it works: It eliminates every friction point between buyer interest and buyer action. No PDFs, no phone calls, no waiting. The buyer gets instant answers and your sales team receives qualified leads with specific unit data attached.
| Metric | Without Tower Map | With Tower Map |
|---|---|---|
| Average time on tower page | 45 seconds | 3–5 minutes |
| Bounce rate | 65–80% | 20–35% |
| Inquiry conversion | 1–2% | 8–15% |
| Lead quality | ”I’m interested in your project" | "I want Unit 4B on the 12th floor, pool view” |
2. Virtual Tour Integration
360-degree virtual tours let buyers walk through unit types without visiting the showroom. This is especially powerful for:
- International buyers who cannot visit in person
- Pre-construction sales where the physical unit does not exist yet
- Premium units where the interior experience justifies the price
Virtual tours work best when paired with interactive tower maps — the buyer selects a unit from the tower map, then enters a virtual tour of that specific unit type.
3. Real-Time Availability Dashboards
Nothing kills a sale faster than outdated information. A buyer who falls in love with Unit 7A only to discover it was sold last week does not buy Unit 7B — they leave.
A real-time availability dashboard:
- Shows current status of every unit (Available, Reserved, Sold)
- Updates instantly when the sales team changes a status
- Creates urgency — buyers can see units being reserved in real time
- Eliminates wasted sales calls about unavailable units
4. Automated Lead Qualification
Not every inquiry deserves the same response time. A buyer who explored 15 units, spent 8 minutes on the tower page, and clicked “inquire” on a penthouse is a higher priority than someone who submitted a generic contact form.
Automated lead qualification systems:
- Score leads based on engagement behavior
- Route high-priority leads to senior sales agents
- Send automated follow-ups to lower-priority inquiries
- Track which units and price ranges generate the most interest
5. Performance-Optimized Developer Websites
Your website’s load speed directly impacts pre-sales. If your tower page takes 5 seconds to load on a mobile phone in Accra or Lagos, you lose the buyer before they see a single unit.
| Load Time | Buyer Bounce Rate |
|---|---|
| Under 1 second | 10–15% |
| 1–3 seconds | 30–40% |
| 3–5 seconds | 50–70% |
| 5+ seconds | 80%+ |
A performance-optimized website built on modern architecture loads in under 1 second on 3G mobile networks — ensuring buyers in emerging markets have the same experience as those on fiber connections.
How Do Interactive Tower Maps Change the Pre-Sales Game?
Of the five technologies listed above, interactive tower maps deliver the most measurable impact with the least implementation friction. Here is why:
The Sales Team Transformation
Without an interactive tower map, your sales team’s day looks like this:
| Time | Activity | Value |
|---|---|---|
| 9:00 AM | Answer call — “How many bedrooms does Unit 3A have?” | Zero — this information should be online |
| 9:15 AM | Answer call — “What is the price on the 8th floor?” | Zero — same repetitive question |
| 9:30 AM | Answer email — “Which units face the pool?” | Zero — could be self-service |
| 10:00 AM | Answer call — “Is Unit 12B still available?” | Zero — availability should update in real time |
| 10:30 AM | Finally speak to a qualified buyer ready to discuss terms | High value |
Your sales team spends 80% of their time answering questions that a website should answer instantly. Only 20% of their time goes to actual selling.
With an interactive tower map:
| Time | Activity | Value |
|---|---|---|
| 9:00 AM | Review overnight inquiries — each includes unit number, floor, price point | High value — pre-qualified leads |
| 9:30 AM | Call buyer who inquired about Unit 12B penthouse last night | High value — buyer already explored the unit |
| 10:00 AM | Call buyer who compared 6 units on floors 8–12 | High value — buyer has specific preferences |
| 10:30 AM | Update 3 unit statuses to “Reserved” in the dashboard | 2 minutes of admin work |
The sales team stops being an information desk and starts being a closing team.
The Buyer Psychology Shift
Something powerful happens when a buyer spends 5 minutes exploring units in your tower interactively. They begin mentally moving in.
They hover over the 12th floor, see the pool-view units highlighted, click into one, scroll through interior photos, check the price, compare it to the street-view unit next door — and suddenly they are not browsing. They are choosing.
This psychological shift — from browsing to choosing — is impossible to create with a PDF. It requires interactive engagement where the buyer controls the exploration.
The Data Advantage
Every interaction on your tower map generates data:
| Data Point | What It Tells You |
|---|---|
| Most hovered floor | Which floors have the highest demand |
| Most clicked unit type | Which configurations buyers prefer |
| Gallery view time | Which interior styles resonate |
| Inquiry-to-click ratio | Which price points convert |
| Mobile vs desktop usage | How your buyers browse |
| Time of day patterns | When to run paid ads |
This is market research that runs automatically. No surveys, no focus groups. Real buyer behavior data that informs your pricing strategy, marketing spend, and future development decisions.
Explore Interactive Tower Maps →
What Results Can Developers Expect?
Based on real deployment data, here is what interactive pre-sales technology delivers:
Short-Term Results (First 30 Days)
| Metric | Before | After | Change |
|---|---|---|---|
| Average time on tower page | 45 seconds | 3–5 minutes | +400% to +600% |
| Bounce rate | 65–80% | 20–35% | -50% to -60% |
| Daily inquiries | 2–5 generic | 5–15 unit-specific | +150% to +200% |
| Sales call duration | 15 min (answering basic questions) | 8 min (discussing terms) | -47% |
Medium-Term Results (60–90 Days)
| Metric | Impact |
|---|---|
| Pre-sale conversion rate | 2x to 4x increase in unit reservations |
| Sales team efficiency | Handle 3x more qualified leads per day |
| Marketing ROI | Digital ads drive traffic to interactive page — higher conversion than static pages |
| International buyer engagement | Buyers explore remotely without visiting — expands your market |
Long-Term Results (6+ Months)
| Metric | Impact |
|---|---|
| Brand differentiation | Known as the developer with the best digital experience |
| Repeat buyer confidence | Buyers trust your next development because you invest in technology |
| Data-driven pricing | Adjust unit pricing based on actual demand data from the tower map |
| Reduced marketing spend | Interactive page converts organic traffic — less dependence on paid ads |
How Should Developers Prioritize Their Technology Investment?
Not every developer needs all five technologies on day one. Here is the prioritized investment order based on impact-per-dollar:
| Priority | Technology | Investment Level | Impact | When To Invest |
|---|---|---|---|---|
| 1 | Interactive Tower Map | Medium (one-time setup) | 🔴 Highest | Before pre-sales launch |
| 2 | Performance-optimized website | Low–Medium | 🔴 High | Before any marketing spend |
| 3 | Real-time availability dashboard | Low (included with tower map) | 🟡 Medium | At pre-sales launch |
| 4 | Virtual tour integration | Medium–High | 🟡 Medium | After initial buyer interest validated |
| 5 | Automated lead qualification | Medium | 🟢 Growing | After consistent lead volume |
Start with the interactive tower map. It delivers the highest ROI, includes availability management, and transforms your sales workflow immediately.
A performance-optimized website is the foundation everything else sits on. If your site is slow, no technology layered on top will save it.
Virtual tours and automated lead qualification are powerful additions — but they matter most after you have consistent traffic and leads flowing through your tower page.
Generic Template vs a Managed Tower Map
| Factor | Generic Floor-Plan SaaS | FoudaTech Managed Tower Map |
|---|---|---|
| Design | Generic template | Custom-matched to your brand |
| Performance | 200KB+ framework overhead | Lightweight — zero frameworks |
| Dashboard | One-size-fits-all | Built for your sales workflow |
| Customization | Locked to template options | Built around your exact building |
| Support | Ticket queue | Direct architect access |
The difference is leverage. A managed tower map turns the brochure image you already have into your highest-converting sales channel — custom-built around your building, then hosted, maintained, and updated for you as you sell.
Frequently Asked Questions
How much does an interactive tower map cost?
Each tower map is custom-engineered based on your building’s complexity — number of towers, floors, and units. Contact us directly for a project estimate. Because FoudaTech operates as a solo architecture studio with zero agency overhead, pricing is typically 30–50% below equivalent agency quotes.
How long does it take to build?
A standard single-tower map with up to 100 units takes approximately 2 weeks from receiving your tower elevation image to delivering the embeddable widget. Multi-tower complexes with 200+ units typically take 3–4 weeks.
Do I need to rebuild my existing website?
No. The interactive tower map is delivered as an embeddable widget — a single script tag that drops into your existing website. It works alongside your current content on any platform, including WordPress, Wix, custom HTML, or any CMS.
Can my sales team update pricing without a developer?
Yes. Every tower map includes a management dashboard where your team can update unit pricing, toggle availability status (Available, Reserved, Sold), and upload gallery images — no developer needed after delivery.
Does it work on mobile phones?
Yes. The SVG overlay system scales mathematically across every viewport. Touch interactions replace hover states on mobile — tap to preview, tap again to open details. The system loads in under 1 second on 3G mobile connections, ensuring accessibility across all markets including emerging regions.
Can I track which units get the most interest?
Yes. The system generates engagement analytics — most viewed floors, most clicked unit types, inquiry conversion rates by price range, and usage patterns by device and time of day. This data directly informs your pricing strategy and marketing spend.
What if I have multiple towers in one development?
The system supports multi-tower developments. Each tower gets its own interactive overlay with shared navigation — buyers can switch between towers and compare units across the entire development from a single page.
Can I keep the tower map private from competitors?
Absolutely. You choose whether your tower map appears in the FoudaTech showcase or remains exclusively on your website. Private deployments include full white-label delivery with zero FoudaTech branding visible to your buyers.